
IRR tutorial workbook
The IRR calculation examples from this tutorial, built out in Excel and ready to follow along with your own numbers. Excel binary workbook (.xlsb).
Enter your details and we will email you the workbook.
Loading the form…
The form did not load. Send us an enquiry and we will email you the workbook.
The internal rate of return (IRR) is a common source of error in financial models. This tutorial shows how to calculate an IRR in Excel and assumes you already know the mathematical idea behind it.
The IRR is the discount rate that, applied to a series of cash flows, gives a net present value (NPV) of nil. In some situations there can be more than one IRR. Excel also makes the calculation look deceptively simple, which invites errors.
The NPV is the discounted value of a stream of cash flows from a project or investment (see our tutorial on how to calculate NPV without Excel functions). The IRR is the break-even rate of return at which the NPV equals zero. It indicates the efficiency or quality of an investment, where the NPV indicates its value or size.
The IRR is the annualised effective compounded rate of return, r. Mathematically:
0=Σ [ CFt ÷ (1 + r)t ], for t = 0 to n
Four ways to calculate IRR in Excel
This tutorial covers four methods:
- Trial and error, to help understanding
- A 1-dimension data table
- The Excel function IRR()
- The Excel function XIRR()
The workbook in the download box demonstrates each calculation. Download it and follow along as you read.
Learn this in a room
Financial Modelling for Corporate Finance
Integrated three-statement models: working capital, funding and valuation. For FP&A, Treasury and Strategy teams. Practitioner-led, in person or online.
The trial and error method
The IRR is the discount rate at which the NPV equals zero, so it can be found by trial and error.
NPV(IRR(…), …)=0
XNPV(XIRR(…), …)=0
The process:
- Start with a guess of the discount rate, r
- Calculate the NPV using r
- If the NPV is close to zero, r is the IRR
- If the NPV is positive, increase r
- If the NPV is negative, decrease r
- Repeat until the NPV reaches zero
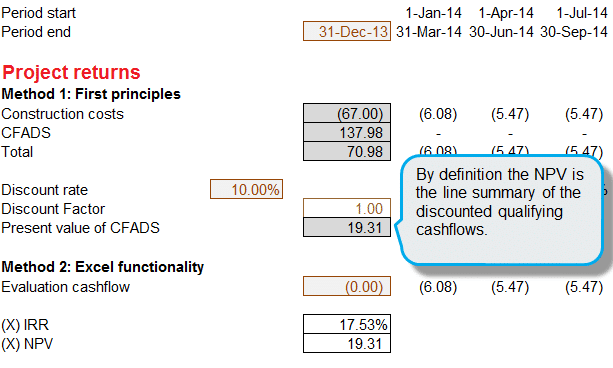
In the workbook example (figure 1), the NPV at a discount rate of 10% is $19.31 million, so the IRR must be more than 10%.
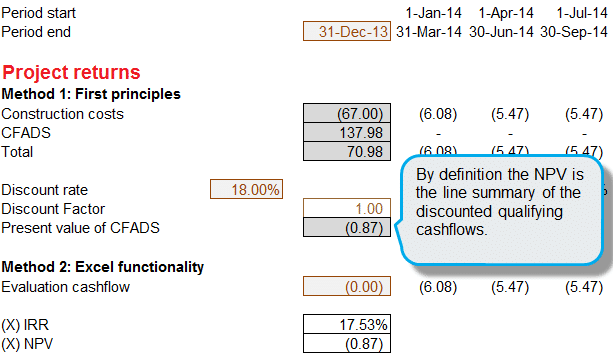
Now try r of 18% (figure 2). The NPV is −$0.87 million. It is negative, but closer to zero, so the IRR should be slightly lower than 18%.
Trial and error can be more tedious than calculating an NPV itself. The next method narrows the guess with a 1-dimension data table.
Spotting the root with a 1-dimension data table
Show the NPV at a range of discount rates in a quick 1-dimension data table, with the discount rates as the vertical parameter, as in figure 3.
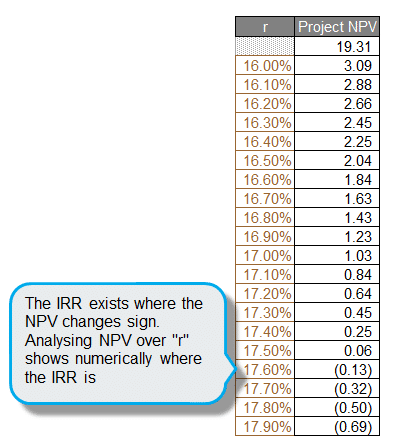
Plot the data table in a chart (figure 4) and it becomes clear that the IRR is between 17.50% and 18.00%. To be precise, the IRR is 17.53%, which the Excel function returns.

The IRR() function and its limits
IRR(CF1, CF2, …)
Excel’s IRR() function calculates the IRR, but like NPV() it has limits:
- The cash flows (CFi) must be equally spaced in time and occur at the end of each period
- The cash flows must be entered in the right order
Why XIRR() is the better function
Because of those limits, the IRR function (without the X) is best avoided. XIRR() is more reliable: it returns the internal rate of return for a schedule of cash flows that need not be periodic.
XIRR() is built into Excel. The syntax is:
XIRR(CFi, dates)

As figure 5 shows, the IRR is 17.53%. Check it by feeding the IRR back into the NPV calculation as the discount rate: the NPV should equal zero.
Capital budgeting and tariff setting
Capital budgeting
The IRR helps decide whether a single project is worth investing in. In theory, a simple rule would accept a project if its IRR is more than the cost of capital and reject it if the IRR is less.
Be aware of the limits of the IRR: a project can have several IRRs or none. The IRR also ignores the size of the project and assumes cash flows are reinvested at a constant rate.
Tariff optimisation
The IRR is commonly used to optimise the toll or tariff regime in project finance transactions, such as public-private partnership (PPP) schemes. This can happen during bidding, based on the expected IRR, or a tariff can be adjusted to give the concessionaire a minimum IRR.
IRR questions
What is the difference between IRR and NPV?
The NPV shows the value, or size, of a stream of cash flows at a given discount rate. The IRR is the break-even discount rate at which that NPV equals zero, so it indicates a project’s efficiency or quality rather than its absolute value.
Should I use the Excel IRR function or XIRR?
XIRR is usually the better choice. The plain IRR function needs cash flows that are equally spaced in time and entered in the right order. XIRR works with an irregular schedule of dates, which is closer to how cash flows occur in most real models.
Why might a project have more than one IRR?
Several IRRs can occur when a project’s cash flows change sign more than once: a large outflow, then inflows, then another large outflow later in the project’s life. In these cases the IRR alone can be a misleading decision measure.
What are the limits of using IRR for investment decisions?
The IRR ignores the size of a project, so a small project with a very high IRR can look more attractive than a much larger project that creates far more value. It also assumes cash flows are reinvested at the IRR itself, which may not be a realistic reinvestment rate.