
Average DSCR tutorial workbook
Excel binary workbook (.xlsb). The two average DSCR methods from this tutorial, calculated side by side.
Enter your details and we will email you the workbook.
Loading the form…
The form did not load. Send us an enquiry and we will email you the workbook.
The debt service coverage ratio (DSCR) is one of the most used debt metrics in project finance. Alongside the DSCR for every period, a project finance model usually reports the average DSCR (ADSCR). There are two ways to calculate it, and they can give very different answers.
Two ways to calculate average DSCR
- Average the DSCRs of every period over the life of the loan
- Divide the total cash flow available for debt service (CFADS) over the life of the loan by the total principal (P) and interest (I)
The two look much the same, but they can give very different results when cash flows or repayments are uneven.
Learn this in a room
Best Practice Project Finance Modelling
Build and sensitise robust cashflow models from scratch, faster in Excel. Hands-on, practitioner-led, in person or online. See dates and book your place.
Method 1: average of the period DSCRs
This is probably the most common way to calculate the ADSCR.
- Calculate the DSCR for every period: CFADS divided by P + I
- Average the period DSCRs with Excel’s AVERAGE function
- Write the formula as an array formula, so that periods with no DSCR (zero) are left out of the average
- In older versions of Excel, confirm the array formula with Ctrl+Shift+Enter
ADSCR = {AVERAGE(IF(range<>0, range))}
Method 2: total CFADS over total debt service
- Add up the CFADS over the life of the loan
- Add up the debt service over the life of the loan: principal plus interest
- Divide the total CFADS by the total debt service
ADSCR=total CFADS over the loan lifetotal P + I over the loan life
When the two methods diverge
Take an example where CFADS is flat and the debt is repaid as an annuity, so P + I is the same every period. Figure 1 shows the repayment profile and Figure 2 the DSCR in every period.
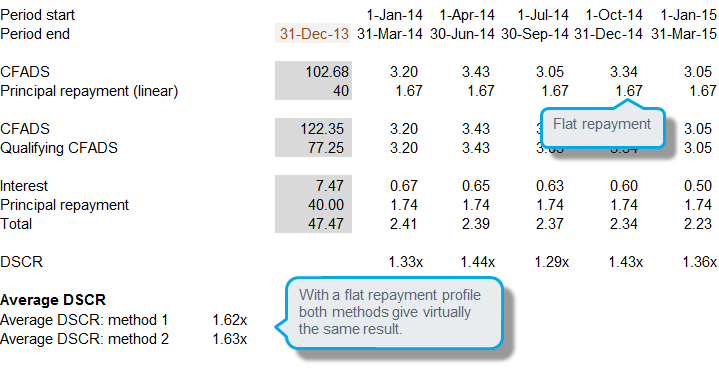

Here the two methods give almost the same average DSCR: 1.62x and 1.63x.
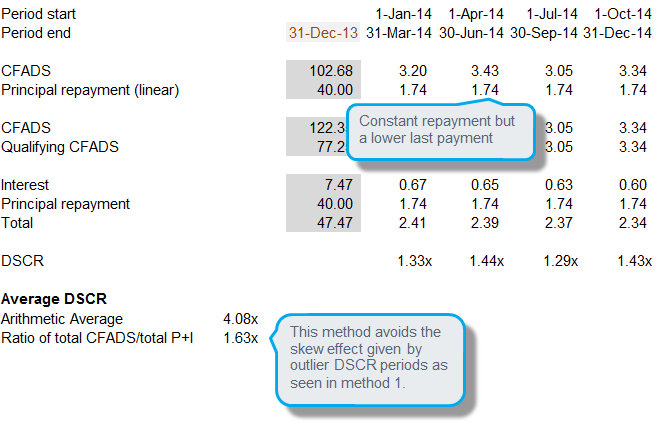
Now keep the repayments flat but make the final repayment smaller than the others. That is not unusual, and it can skew the average badly: the DSCR in the final period is far higher than in every other period. Table 1 shows the effect with simple numbers.
| Period | CFADS | Debt service (P + I) | DSCR |
|---|---|---|---|
| 1 | 20.0 | 12.0 | 1.67x |
| 2 | 20.0 | 12.0 | 1.67x |
| 3 | 20.0 | 12.0 | 1.67x |
| 4 | 20.0 | 12.0 | 1.67x |
| 5 (final) | 20.0 | 5.0 | 4.00x |
Table 1: Illustrative numbers, with a lower final repayment.
Method 1, the simple average of the five period DSCRs, gives 2.13x, pulled up by the final period’s 4.00x. Method 2, total CFADS of 100.0 divided by total debt service of 53.0, gives 1.89x, far less distorted by the one unusual period.
What each method measures
- Method 1 averages the DSCR values over time and treats every period as equally important
- Method 2 weights each period by the size of its principal and interest, so a period with unusually low debt service has less influence on the result
When cash flow and debt service are flat, as in the first example, the difference does not show. It shows when there are extreme values, such as a very small final repayment: the last period’s DSCR is very high, and Method 1 gives it the same weight as every other period.
Which average DSCR method to use
Neither method is wrong. What matters is knowing what each one means and where it falls short. Where the repayment profile is uneven, Method 2 is usually the more meaningful figure and gives a truer picture of the average.
Average DSCR questions
What is the difference between the two ADSCR methods?
Method 1 averages the DSCRs of every period, treating each period equally. Method 2 divides total CFADS by total debt service over the life of the loan, which weights each period by the size of its debt service. The two agree closely when cash flow and repayments are flat and diverge when one period is unusual.
Why do the two methods give different results with an unusual repayment?
A period with very small debt service has a very high DSCR. Method 1 gives that one high value the same weight as every other period and pulls the average up. Method 2 weights by the size of debt service, so it is far less affected.
Which ADSCR method should I use?
Neither is wrong, but Method 2 is usually more meaningful where the repayment profile is uneven, because one unusual period cannot distort it the way it distorts a simple average.
Why is the Method 1 formula an array formula?
So that periods with a zero DSCR, such as those before the first repayment or after the last, are left out of the average instead of pulling it down.