
This article is Part 3 in the series “How to speed up your models”; Part 1 and Part 2 are available on the Forvis Mazars Financial Modelling website. This final part will focus on some commonly used Excel functionality which can slow down financial models and practical tips to minimise the impact on calculation speed while still including the desired functionality. In terms of calculation speed, sometimes what you don’t include in a model can matter just as much as what you do!
External links
In Microsoft’s own words…
“Avoid inter-workbook links when it is possible; they can be slow, easily broken, and not always easy to find and fix.”
There’s not much more to say about external links other than to avoid using them whenever possible. If there are inputs to the model which should come from another Excel file, then these inputs should be brought in via pasting values into the model and updating when needed. This will also prevent inputs accidentally being updated via the source file and will ease the process of sharing the model between different teams and organisations who may not have access to the source file.
Note there are numerous ways an external link can unintentionally be created within a file, of which we have listed the most common types in the table below. To check if you have any external links in your workbook you can go to Data > Queries & Connections > Edit Links. If this option is greyed out the file does not have any external links.
| Type | Cause | Solution |
| Links in formulae | Pasting links instead of pasting values | Search within the entire workbook for “.x” |
| Links in named ranges | Copying in sheet(s) from other workbooks | Open the name manager and sort the “Refers to” column to find names referring to other workbooks |
| Links in chart data | Copying in chart(s) from other workbooks | Go to “Select data” for each chart and check if any data is being sourced from an external file |
Because Excel attempts to automatically update external links and notifies the user via a pop-up whenever the Excel file is opened, these unintentional links should be removed to improve both performance and the user experience.
Data tables
Data tables are a powerful way to compare outputs across scenarios or test sensitivities, but they can slow calculation speed. In modelling, they are often used to show outputs for multiple scenarios at once. However, this requires the model to recalculate every scenario each time, which impacts performance and should be avoided if speed is an issue.
If a model must use a data table, performance can be improved by setting calculation to “Automatic except for data tables.” This prevents non-active scenarios from recalculating unless triggered manually. However, this method is not always accurate, as explained below.
In models with optimisation macros (e.g. debt sizing), data tables cannot run the macro for each scenario and instead apply live case results to all scenarios, leading to incorrect outputs. Combined with performance issues, this makes data tables a poor choice for scenario output tables in project finance models. A better approach is to use a VBA macro to run each scenario, execute the optimisation, and paste the results into the output table. This produces the same result without the performance or accuracy risks.
Charts
You can do a lot using Excel charts however this blessing can also sometimes be a curse from a performance perspective. Sometimes modellers go over the top including too much data, excessive formatting or simply including far more charts than necessary. We provide recommendations in each of these areas below, however the key idea is to just keep it simple when it comes to charts.
Including too much data:
If a chart has five or more data series, it’s likely too busy, combine series or remove irrelevant data. Also check data frequency: annual data often gives the same insight as monthly or quarterly but with far fewer points.
Excessive formatting:
Fancy formatting like 3D charts or gradients slows performance and often makes charts harder to read. Keep formatting simple and avoid excess features, colours, or fonts so charts run faster and are easier to understand.
Including too many charts:
Think carefully about your audience and what information they really need. Do not include extra charts just for the sake of it; the goal should be to make the summary page as short as possible (i.e. usually one to two A4 pages, depending on your audience). You may also want to consider replacing some charts with sparklines, which are much more economical from both a calculation and space perspective, and much faster to create.
Conditional formatting and data validation

Conditional formatting and data validation are very useful features of Excel which we should all be utilising as appropriate, however using them a lot will significantly slow down calculation speed. Note also that conditional formatting rules which use formulae are always volatile and therefore are particularly slow. For this reason, the use of these features should be limited, especially in large models. In slow models, conditional formatting should be one of the first features to reduce. It is mainly for presentation and does not affect calculations.
Note some applications of conditional formatting can be achieved through the non-volatile number formatting functionality instead, if you understand the custom formatting notation Excel uses.
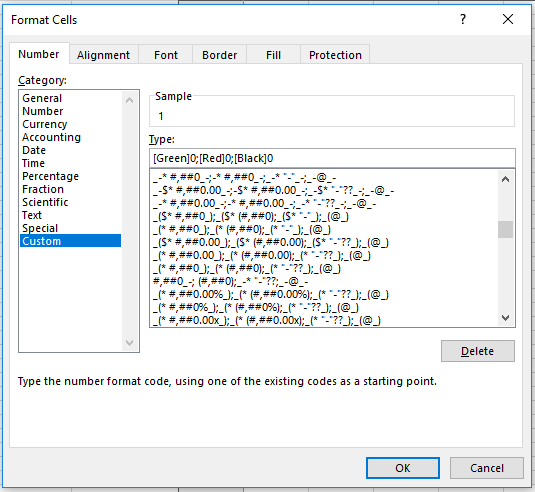
As a simple example, if you want to display positive numbers in green, negatives in red and zero in black you can use the following code:
[Green]0; [Red]0; [Black]0
By default, Excel defines four different types of data for formatting purposes, separated by semicolons in custom number formats. These are:
positive values; negative vales; zero; text
As a simple example, if you want to display positive numbers in green, negatives in red and zero in black you can use the following code:
[Green]0; [Red]0; [Black]0
By default, Excel defines four different types of data for formatting purposes, separated by semicolons in custom number formats. These are:
positive values; negative vales; zero; text
You can define different groupings using the custom number formats. A simple example with groupings of <100 and >=100 is shown below. Note this flexibility will allow custom number formats to replace conditional formatting in some instances.
[Red][<100]0; [Blue][>=100]0
For more on conditional formatting and custom number formats, see the further reading section below for useful resources.
Other potential issues
Other common modelling issues can also accidentally affect performance. A number of these are explained below including recommendations on how to avoid or fix them.
End cells:
Modellers often extend the used range far beyond what is needed, for example by formatting the far-right column or bottom row. This makes Excel save every column or row, greatly increasing file size. While it may not slow calculations, it can make opening and saving much slower and may even cause crashes.
You can check the used range on each sheet by going to the end cell (CTRL + END). It is also advisable to check the file size periodically to see if there is an unexplained jump which might mean the used range has been expanded.
Excessive range names:
Having excessive amounts of named ranges will slow down calculation speed because names are recalculated each time they are referenced by a formula that is recalculated. Note also that although dynamic named ranges can be very useful (created using OFFSET and COUNTA), they are volatile and therefore will impact calculation speed as well.
Periodically check named ranges look ok and there aren’t too many of them in the name manager, (CTRL + F3).
Excessive cell styles:
Cell styles help maintain consistent formatting, but too many can slow your model. This often happens when copying data or sheets from other workbooks, so use them carefully.
We recommend copying only formulae or only values for the ranges of cells needed as this won’t bring in the cell styles or formatting associated with those cells. You should also periodically cull excess cell styles from your workbook.
Event-based VBA code and add-ins:
Excessive event-based VBA code, personal macros, or multiple add-ins can all significantly impact performance.
You can check whether VBA is causing calculation impacts by re-opening the file and holding down SHIFT. This disables any macros in the workbook. If you notice a performance improvement you can test which macro or add-in is causing issues through a process of elimination by individually enabling/disabling each until you find the culprit(s). It is also good practice to periodically assess whether you have add-ins which you no longer use and therefore should be removed.
Excessive grouping:
Again, we are big advocates of using grouping to present different levels of information and avoid hiding cells, however using grouping excessively may impact model performance.
Consider how many levels of grouping are really required for your model. Typically, one to two levels will be sufficient for most cases.
Wrapping up
This concludes our series on How to speed up your models. If you are interested in learning more about financial modelling we have a wide range of resources on our website including tutorials, webinars and blogs. We have also included a selection of further reading on the topics covered in this post below.
Further reading:
External links:
- See the “Remove Phantom Workbook Links” section of this article on Reducing Workbook and Worksheet Frustration (opens in a new tab)
- Data tables:
- For an overview of how scenarios and sensitivities are used in PF models, please see our webinar on Creating Sensitivity Tables for Infrastructure Project Analysis. The use of a data table for scenario analysis is shown from minute 34 of the video.
Conditional formatting:
- Excel: Replacing volatile conditional formatting (opens in a new tab)
- Excel custom number formats (opens in a new tab) (comprehensive explanation of Excel’s custom number formats)
- Custom formats builder/tester (opens in a new tab)